What is ridging?
Ferritic stainless steel is widely used in the production of goods that need high corrosion resistance and an excellent surface appearance. For the fabrication of dishes, pots and sinks, deep-drawing is the usual forming method. Sometimes, stretch-forming is applied. Despite its excellent forming properties, FSS is prone to a surface defect known as “ridging”. This can appear on otherwise defect-free material after forming operations. Ridging is characterized by the formation of small parallel elevations and valleys which develop in the rolling direction when the sheet material is elongated. See Figure 1. Not all ferritic grades are affected equally by ridging. It can tend to occur more in some grades than others. Furthermore, similar grades of FSS produced by different manufacturers can also exhibit very different levels of ridging when subjected to the same forming operation.A very brief explanation of why ridging occurs is that it is the result of anisotropic plastic deformation caused by colonies of different crystal orientations in the rolled sheet. Anisotropic means that the deformation changes according to the direction of strain. While ridging is seen in the final product the likelihood of it occurring is largely pre-determined during the casting process, when the crystal structure is formed.
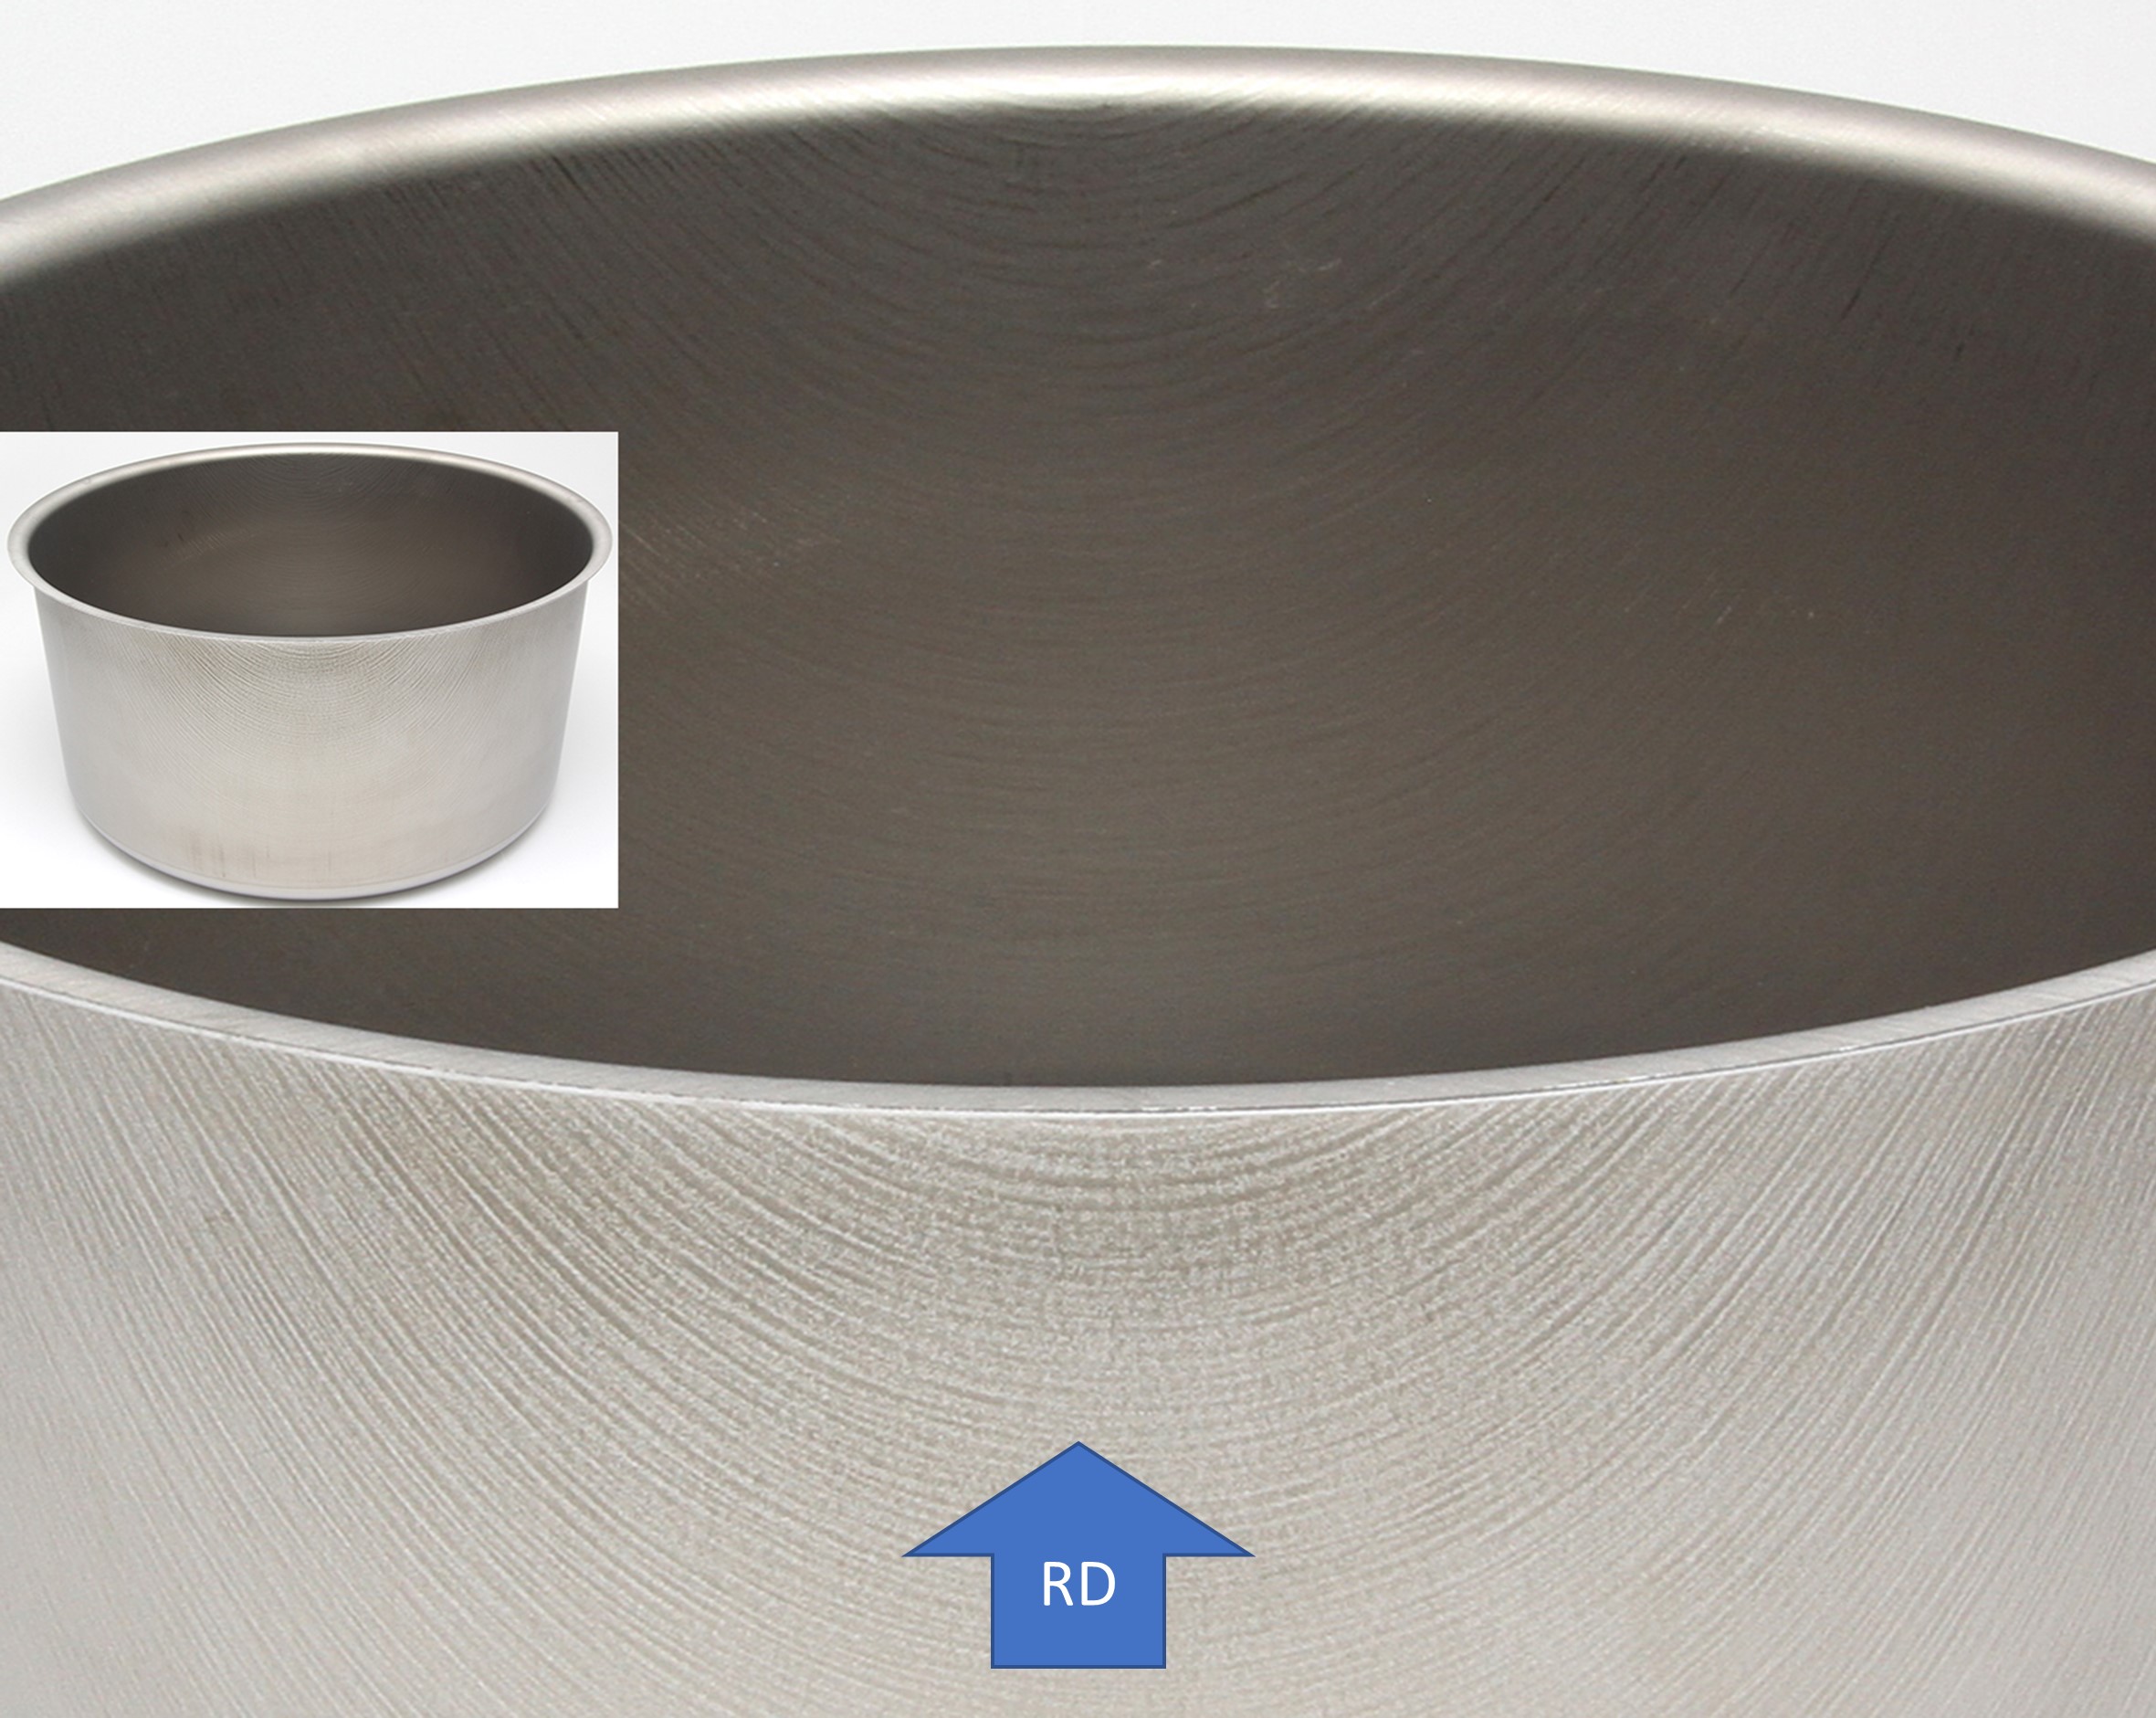
Ridging is most prevalent when the material is strained along its rolling direction (RD) and absent when the sheet is elongated along its transverse direction (TD). The distance between two ridges is usually in the range of a few millimeters.
The additional profile height that is introduced by the ridging surface defect may be up to
± 50 m depending on the applied strain. See Figure 2.
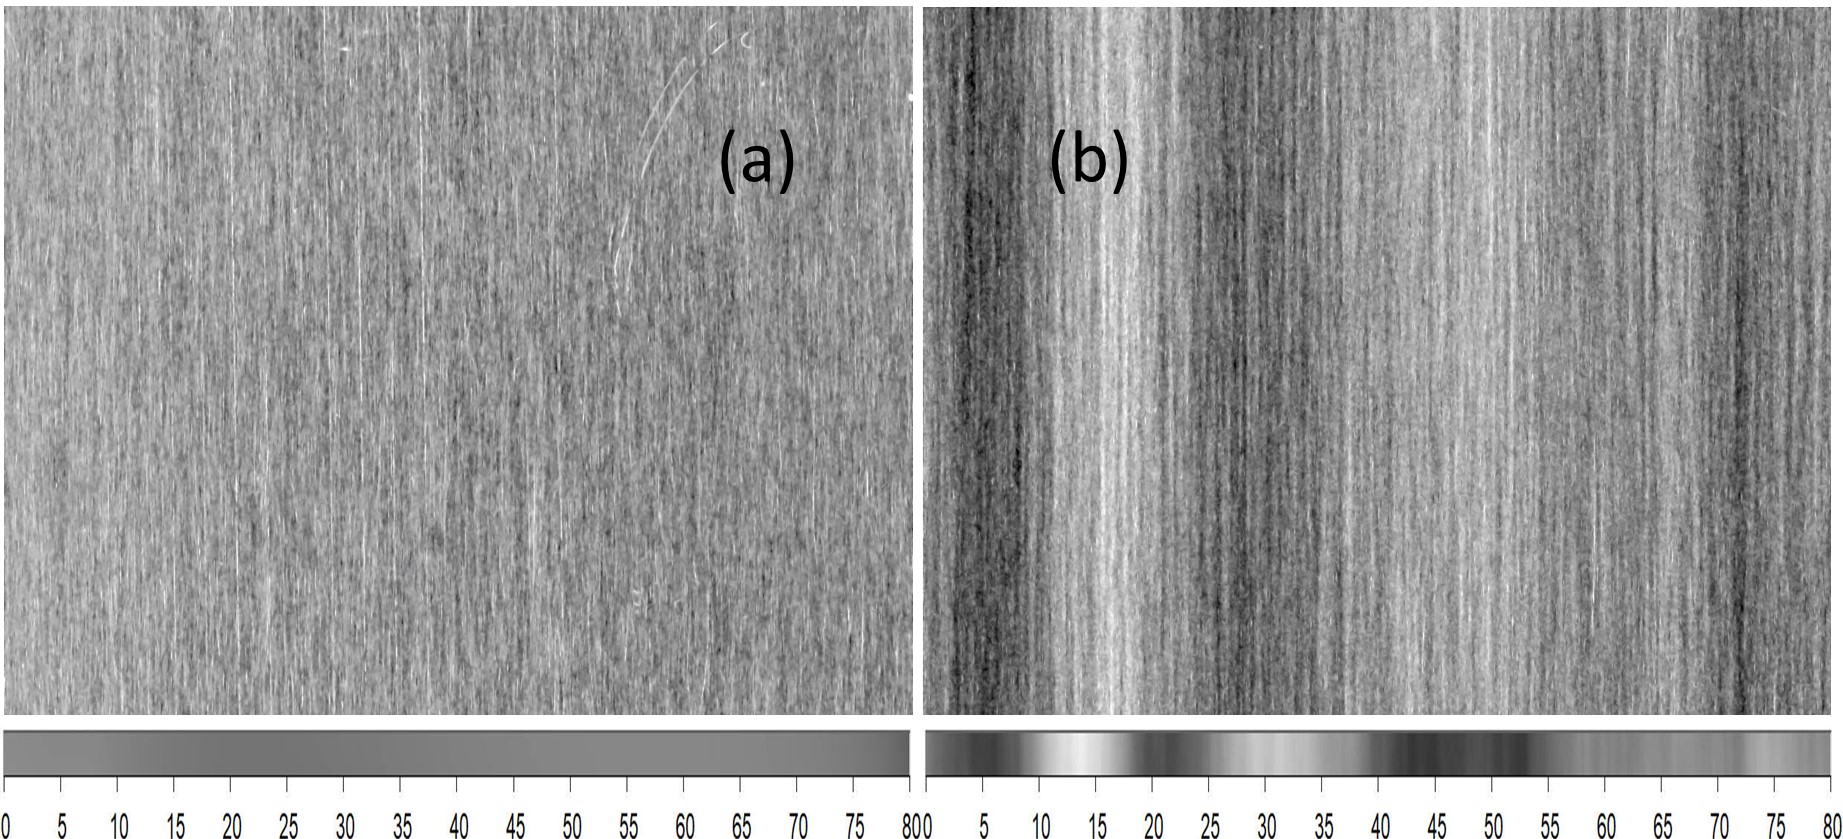
The consequence of ridging is that additional mechanical polishing is required to achieve the desired high-quality surface finish. This increases the production costs, especially as the polishing is needed not only to remove the peaks of the ridges, it also has to bring the surface down to the troughs. In the worst cases, the amount of polishing required will cause the product to be rejected.
Visual assessment of ridging
For industrial quality control purposes, samples of the FSS sheet are strained to a defined elongation, typically between 7% and 20%. The samples, normally standard 20 mm wide tensile test specimens, are then given a visual inspection and rated against an arbitrary scale (usually from 1 to 5 or 1 to 10).
This type of ridging assessment is usually carried out by specially trained personnel, often using a set of reference specimens. The results are subjective and may be biased both by the person doing the evaluation and the environment in which it takes place.
Using a profilometer to measure ridging
A more rigorous approach is to use a profilometer to assess the ridging of the tensile test specimen. This is a specialist instrument that measures the profile of a surface, in order to quantify its roughness. Various types of profilometer are available that use either a sensitive stylus in contact with the surface or non-contact optical techniques.
The amount of ridging measured by the profilometer is characterized by surface roughness parameters, which are typically determined according to common measurement standards. Often the arithmetic average of the roughness profile - Ra and/or the maximum height of the profile - Rt are the measure for the intensity of ridging.
Typically, the recorded raw profile is relatively short and covers only a few ridges. This measured profile is then filtered electronically. However, this filtering uses standards that were not developed for ridging. Furthermore, the spacing of the ridges is rarely considered in this type of investigation. That means the results may not be representative for the FSS sheet material under examination, making it hard to evaluate ridging appropriately in terms of its amplitude and the spacing between the peaks and valleys.
The need for a new approach
The qualitative measurement of ridging used to date has made it difficult for industrial customers to carry out quality control procedures. It also presents challenges for researchers and steel manufacturers.
This was the driver for Outokumpu’s research program to find an improved method for measuring the profile. The aim was to combine better sample geometry with a tailored filtering method. This would then provide the basis for a calculated ridging index that considers both the profile height and the spacing of the ridges. It was also desirable for the new ridging index to correlate well with visual inspection results.
A larger size of test sample
The width of standard 20 mm tensile specimens after 15% straining is typically 17 mm, which is just enough to perform a standard surface roughness measurement. However, as the distance between ridges is typically between 1 to 3 mm, usually only 4 to 12 complete surface features are included in such a measurement. That is not sufficient to characterize the ridging of an FSS sheet with good statistical reliability. To overcome this limitation and to improve the confidence of the results, it was decided that wider sheet specimens should be used.
In this project, EN 1.4016 and EN 1.4509 FSS sheets with thicknesses between 0.5 and 1.5 mm served as test materials. Rectangular samples with a length of 300 mm and a width of 100 mm were strained at various levels of elongation parallel to the RD.
Surface profiling and evaluation
Two different types of profilometers were used in this study: an optical 3D white light interferometer and a non-skidded bench-top 2D stylus. The 2D raw profiles of strained ridging test specimens contain three components:
- The overall shape of the specimen
- The ridging profile itself
- The residual profile caused by the surface roughness of the sample and instrument noise
Filtering was applied to separate the ridging profile from the shape of the specimen and from surface roughness and instrument noise. See Figure 3.
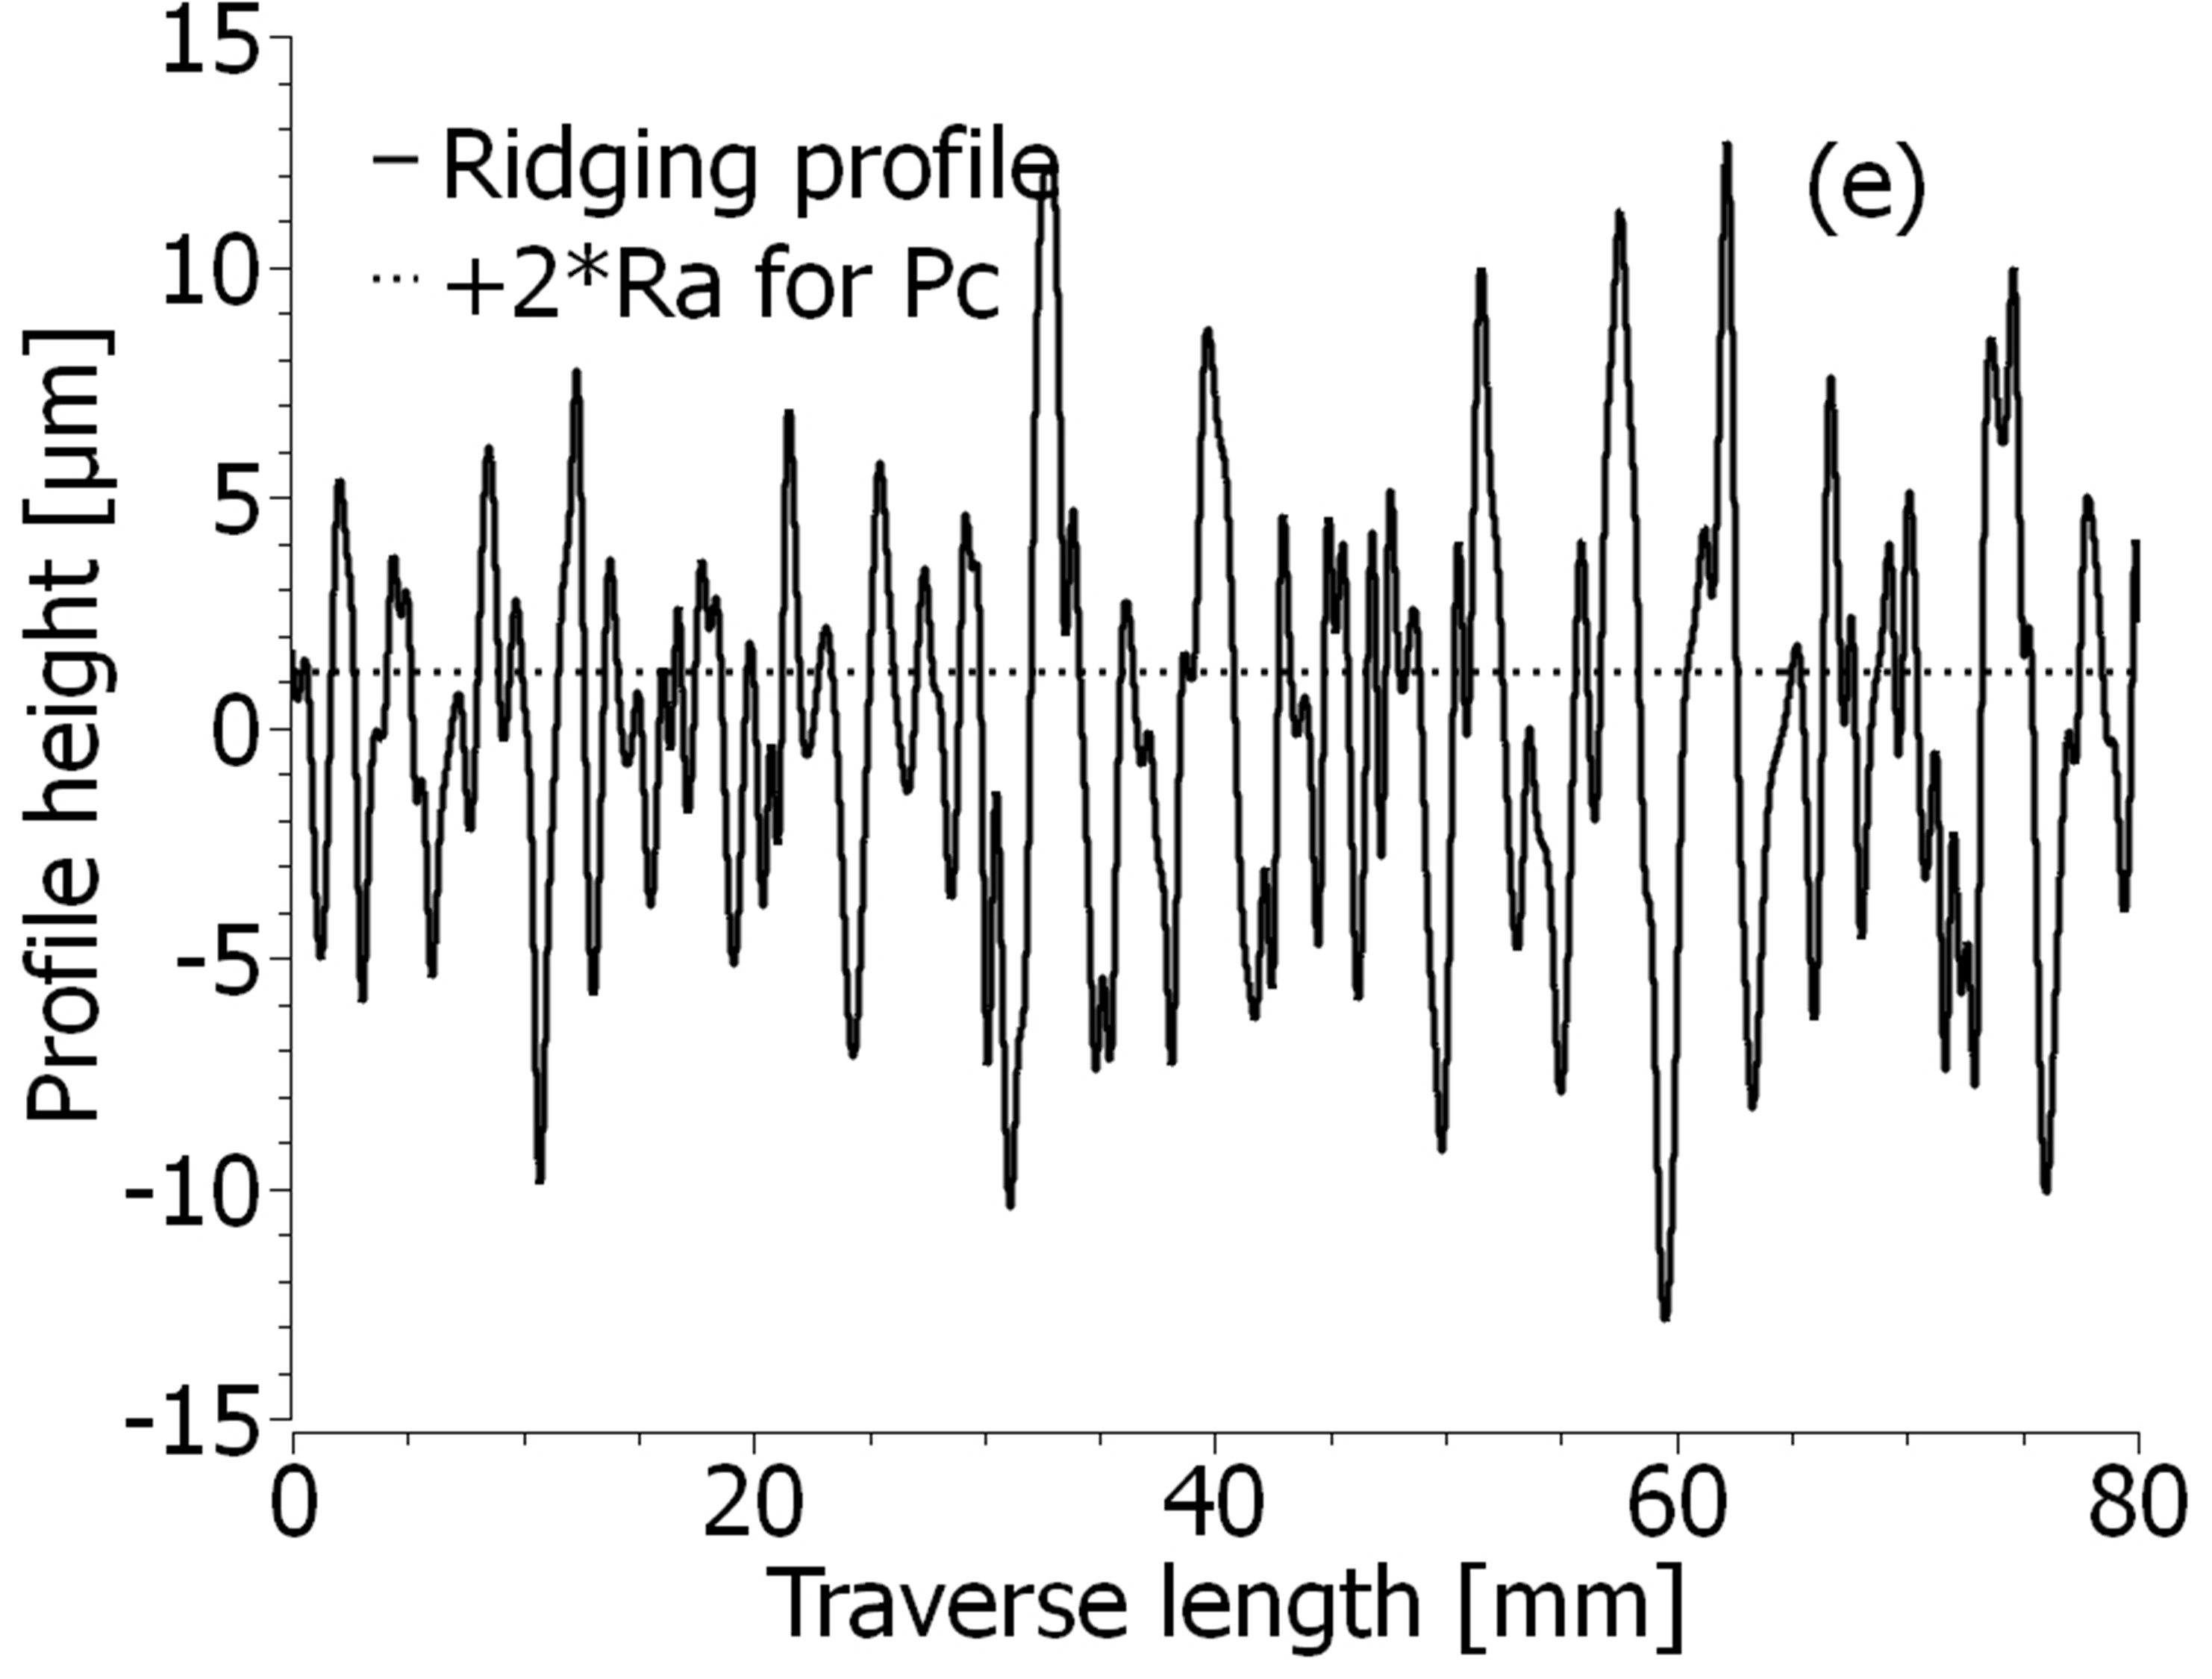
It is also important to know how many ridges and valleys there are. As a higher number means that the ridging surface defect will be harder to remove. This is measured by the peak count - Pc. A threshold is set to determine Pc – as shown by the horizontal dotted line in Figure 3.
Rz in m and Pc in mm-1 are multiplied to calculate RI, the dimensionless ridging index.
Test program

A series of measurements with the same FSS sheet after elongations of 0%, 2%, 5%, 10% and 15% were recorded with the optical 3D profilometer. Figures 4(a) and 4(b) show that RI and Rz depend linearly on the applied elongation. Pc is nearly constant and grows only slightly. As expected, the highest RI was determined for the highest elongation. Therefore, all subsequent ridging measurements were carried out with an elongation of 15%.
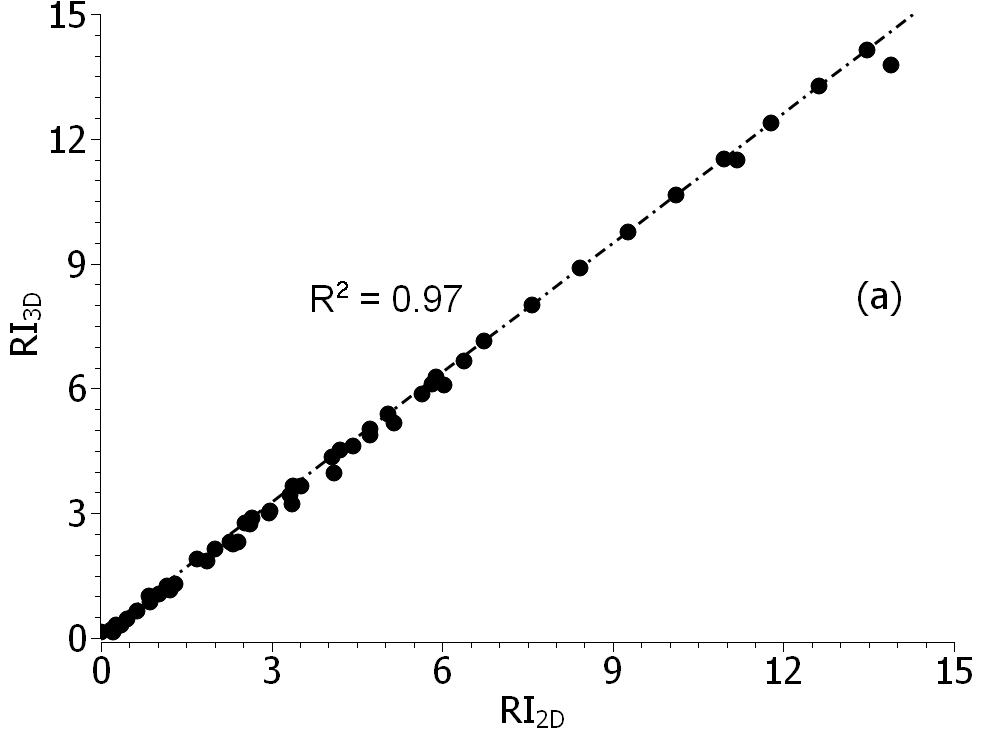
The ridging profiles of both the top and bottom surfaces of another sample were measured to check if this affected the measurements. The similarity of the results indicated that the determined RI is not influenced by the measured surface – the peaks on one side correspond to valleys on the other and vice versa.
Repeatability
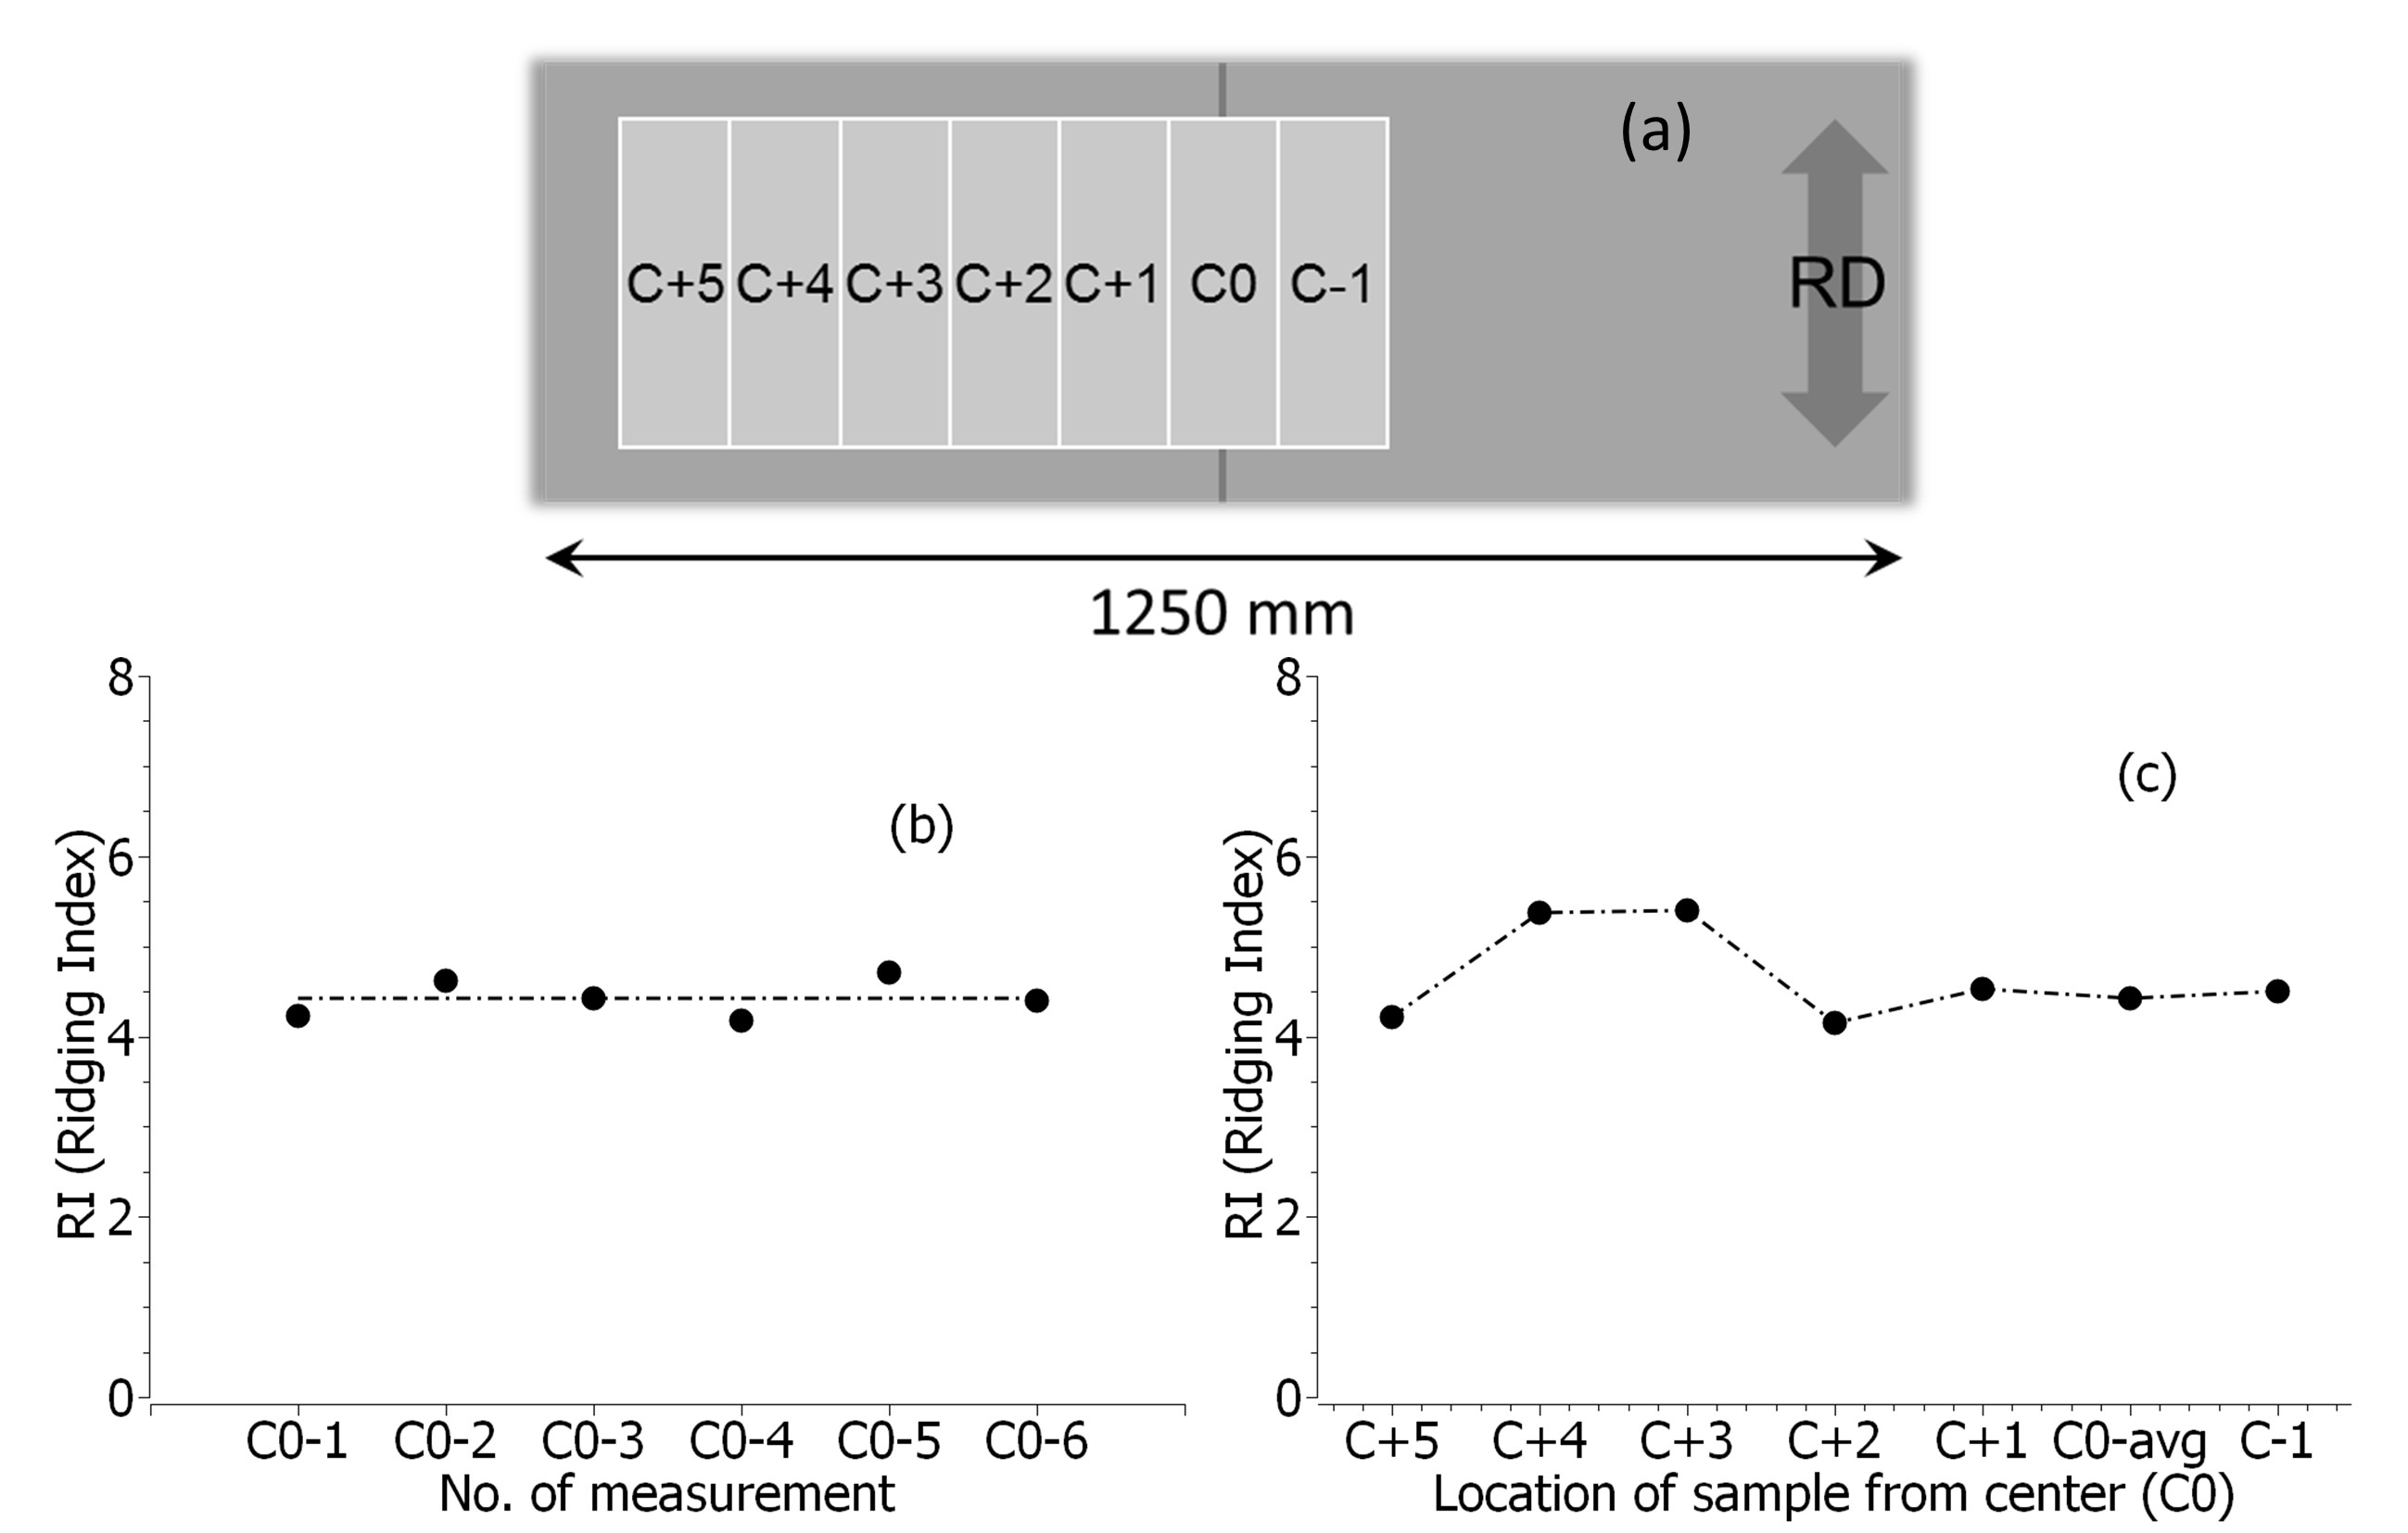
Four of the six additional specimens had similar RIs to the center sample. The two samples that had been cut furthest from the center of the sheet width showed RI values about one unit higher. As the other measurements all produced very similar results, this variation has to be considered as significant, indicating perhaps a locally different texture in the FSS sheet.
Comparison with visual assessment
| Sample | Person 1 | Person 2 | Person 3 | Person 4 | Person 5 | Average | Ra | Rz | Pc | RI |
| A | 4 | 3 | 3 | 2 | 2 | 2.8 | 0.46 | 9.6 | 0.22 | 2.1 |
| B | 9 | 7 | 5 | 9 | 5 | 7.0 | 0.35 | 25.5 | 0.30 | 7.5 |
| C | 1 | 0 | 1 | 1 | 1 | 0.8 | 0.11 | 4.2 | 0.28 | 1.2 |
| D | 8 | 5 | 3 | 7 | 4 | 5.4 | 0.48 | 13.7 | 0.27 | 3.7 |
| E | 7 | 5 | 8 | 3 | 8 | 6.2 | 0.35 | 11.1 | 0.40 | 4.4 |
The people carrying out the assessment used an arbitrary scale between 0 and 10. The variation between the ratings of different people was huge in some cases. However, the average result produced by the reference group and the RI measurements gave the same ranking between the specimens. The average rating numbers correlated well with the RIs.
Using the RI method
Establishing a repeatable and easy to use method of measuring ridging is an important step for the ferritic stainless steel industry. Outokumpu is therefore making the methodology behind the development of the ridging index freely available to all interested parties.

